Our own image-processing algorithm is used to produce superbly sharp screen images.
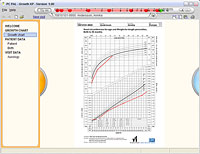
Auxological variables such as height, weight and puberty descriptors are fed directly to the component and are plotted in the chart automatically.
The charts can be manipulated actively.
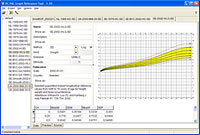
Zoom the graph directly by selecting an area to magnify using the mouse. Right click in the chart to open a pop-up menu selection to zoom, copy the graph to the clipboard or print. Move the cursor over data point markers to see the exact values in a hint. These hints can also display alternative information assigned by the programmer during the integration process.
When exporting charts to other programs the user can select from the commonly used file formats of JPEG, GIF, PNG, or EMF.
PC PAL growth charts are created using our extensive internal library of population data sets. This means that any of these references can quickly be added to the growth chart templates you have selected.
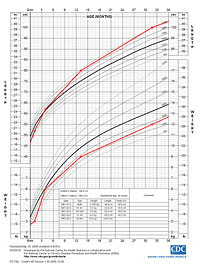
Each version of the component is supplied with the most often used charts. These are typically for height, weight, BMI, head circumference, height velocity, and premature birth. Population and disease specific varieties are available.
Included with the charting component is a calculation engine for deriving both plain values and population referenced transforms. These include SD (z) scores, target height by different methods, BMI and height velocity. All calculated variables can be viewed in clear tables.
All charts can be printed in a quality standard matching official paper versions.
Charts can be copied to the clipboard and pasted into other programs such as MS PowerPoint and Word for articles and presentations.
The chart component can be integrated into applications written in C#, Java, VB.NET, VB, Delphi and others. It also has a unique web interface to allow integration into pure web applications with no add-ons.